
The world of trading is filled with various tools and indicators to help traders navigate the markets. One such tool that has gained considerable attention over the years is the Ichimoku Cloud. Though it may seem complex at first, the Ichimoku Cloud is an incredibly powerful tool when used correctly. In this guide, we’ll break down the Ichimoku Cloud, explaining its components, how to use it, and how it can improve your trading strategy.
What is the Ichimoku Cloud?
The Ichimoku Cloud is a comprehensive trading indicator that provides a clear picture of support, resistance, trend direction, and momentum all in one glance. It was developed by Japanese journalist Goichi Hosoda in the late 1960s and has since become a popular tool for traders worldwide. The purpose of the Ichimoku Cloud is to give traders a holistic view of the market, rather than relying on isolated signals from a single indicator.
This tool stands out because it’s not just one line or one signal—it’s a combination of several key components that give a deeper understanding of price action. The beauty of the Ichimoku Cloud lies in its simplicity: it allows traders to quickly assess market conditions and make informed decisions. Explore ADSS for more information.
Why Beginners Should Learn It
For beginners, the Ichimoku Cloud may seem intimidating at first, but once you understand its components and how they work together, it becomes an invaluable tool. Unlike many other indicators that require constant monitoring or tweaking, the Ichimoku Cloud offers a comprehensive snapshot of market trends with minimal effort. It’s a powerful tool for trend-following traders, as it can help identify the start and end of trends, areas of support and resistance, and potential reversal points.
Moreover, its ability to show both trend direction and momentum makes it more versatile compared to other technical indicators. Once mastered, it can provide traders with better entry and exit points, minimizing risk and maximizing potential returns.
The Basics of Ichimoku Cloud
The first component is the Tenkan-Sen or Conversion Line. This line is calculated by averaging the highest and lowest prices throughout nine periods. It acts as a short-term trend indicator and helps identify potential price shifts. The second component is the Kijun-Sen, also known as the Base Line. The Kijun-Sen is calculated in the same way as the Tenkan-Sen but uses a longer period—typically 26 periods. It’s a more stable line and serves as a reference for long-term trends.
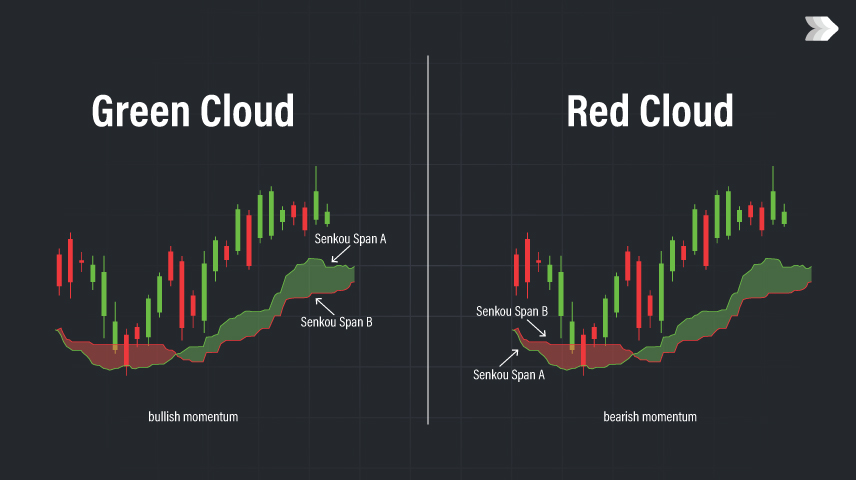
The Senkou Span A and Senkou Span B, or Leading Spans, are the next key components. These lines are responsible for forming the “cloud” or Kumo. Senkou Span A is the average of the Tenkan-Sen and Kijun-Sen, and it is plotted 26 periods ahead. Senkou Span B is calculated by averaging the highest and lowest prices over 52 periods, and it is also plotted 26 periods ahead. The area between these two lines creates the cloud, which is the most visually prominent feature of the Ichimoku Cloud.
Finally, there’s the Chikou Span or Lagging Line. This line is simply the closing price plotted 26 periods behind the current price. It is used to confirm trends and assess the strength of a move. When the Chikou Span is above the price, it indicates a bullish trend, and when it’s below, it indicates a bearish trend.
Interpreting the Ichimoku Cloud
One of the most powerful aspects of the Ichimoku Cloud is its ability to give clear visual cues about market trends, momentum, and potential reversal points. The cloud itself is a major component of this, as it can provide immediate insight into the direction of the market.
When the price is above the cloud, it generally indicates that the market is in a bullish trend, and this could be a signal to buy. On the other hand, when the price is below the cloud, it typically suggests a bearish trend, which could be a signal to sell or short. If the price is within the cloud, it suggests a neutral market, and the trend is unclear, which could indicate caution in making trades.
Support and resistance levels are also easily identified using the cloud. The top and bottom edges of the cloud act as dynamic support and resistance areas. When the price approaches these levels, it can either bounce off or breakthrough, indicating a potential shift in the trend.
Conclusion
The Ichimoku Cloud is an incredibly versatile and powerful tool that can help traders make more informed decisions in the markets. Whether you’re a beginner or an experienced trader, understanding the basics of the Ichimoku Cloud and how to interpret its signals can enhance your trading strategy. Remember to start with the fundamentals, use it in conjunction with other indicators, and practice in different market conditions to fully harness its potential. With time and experience, the Ichimoku Cloud can become an indispensable part of your trading toolkit.


